- Last Money In - Newsletter on Venture Capital Syndicates
- Posts
- Why Your VC Portfolio May Seem to Be Failing (And Why That's Normal)
Why Your VC Portfolio May Seem to Be Failing (And Why That's Normal)
a newsletter about VC syndicates
Alex Pattis & Zachary Ginsburg
October 09, 2024

🚀 Unlock Elite Startup Deals without an upfront commitment! 🚀
Last Money in is Powered by Sydecar
Sydecar empowers syndicate leads to manage their investments more effectively. Organize, manage, and engage your investor network effortlessly with Sydecar’s management and communication tools. Their platform also automates banking, compliance, contracts, tax, and reporting, freeing up syndicate leads to focus on securing deals and strengthening investor relations. Elevate your syndicate operations with Sydecar.
Fill out our unique form to get to the top of the line here.

Deal Sheet Free Trial. Start your 7 day trial here!
We are excited to offer a free trial to interested Deal Sheet subscribers. This will consist of a 7 day free trial to see the quality of deals and explore becoming a subscriber.

Deal Sheet provides accredited investors:
Access to some of the best startup opportunities across the VC syndicate ecosystem (est. 150-200 deals on Deal Sheet per year) and
All Deal Sheet deals come at discounted carry – all opportunities on Deal Sheet are listed at 10% carry (versus 20% standard) with select opportunities (at our discretion) at 0% carry.
Try the free trial today here!
Why Your VC Portfolio May Seem to Be Failing (And Why That's Normal)
If you’ve been an LP in SPVs for less than 5 years, odds are you’ve seen a lot of your companies fail or distribute only partial capital back, while actually receiving minimal distributions from winners, leaving you likely disillusioned with the asset class. It feels callous to say this is normal and should be expected, but it's also the truth. Of course if you’re 5-8+ years into active VC investing with no line of sight to any of your portfolio companies becoming the outlier then that’s tough, but hopefully that’s not many of you.
Enter the J Curve
The J-curve is a key concept in venture capital that illustrates the typical pattern of returns for VC investments over time. The J-curve is a visual representation of the financial performance of a venture capital fund or investment over time, but is equally relevant for LPs in SPVs. It depicts the initial negative returns experienced in the early stages, followed by a significant upward trajectory as successful investments start to generate positive returns.
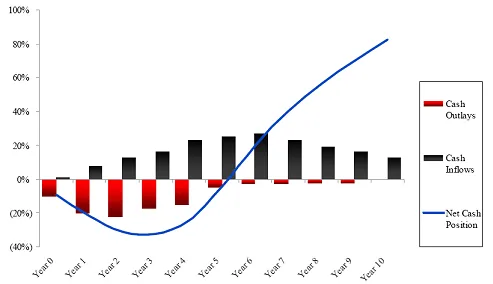
Causes of the J-Curve Pattern
The initial dip in the J-curve and the generally early feeling that your losing money in venture capital is primarily due to:
Upfront costs associated with early-stage investments
Management fees and SPV expenses
Many startups failing fast
Time required for winning startups to develop and grow
It’s estimated that 60% of startups fail between the pre-seed and Series A funding stages with 30% of startups estimated to fail by the end of year 2, so that’s a lot of failure felt very quickly if you’re investing early.
Steep Upward Trajectory
The upward slope of the J-curve is driven by:
Maturation and success of portfolio companies
Realization of returns through exits (e.g., acquisitions or IPOs)
Exponential growth of successful startups
The duration for a VC investment to reach the inflection point of the J-curve can vary, but it typically takes several years, in some cases over five years or more.
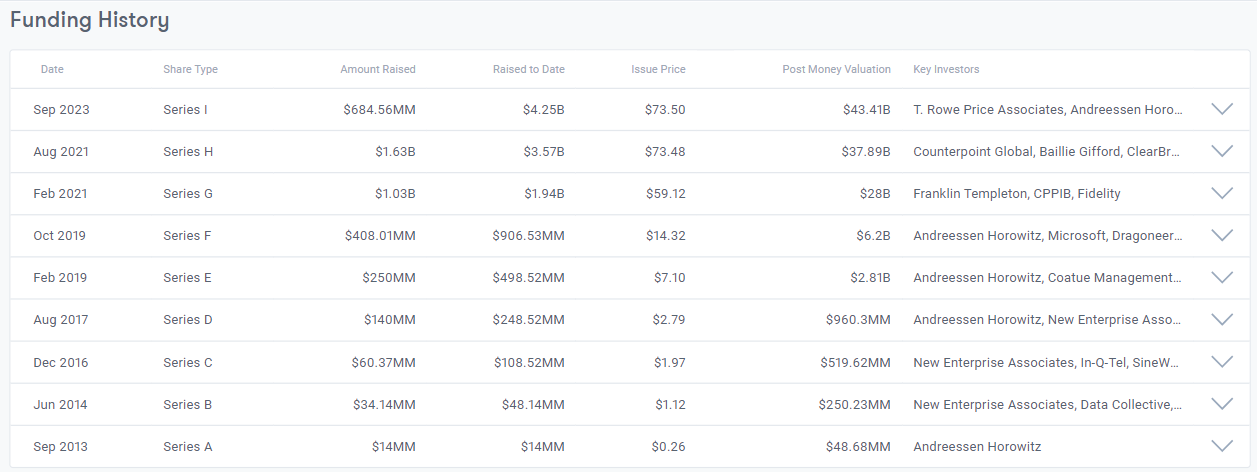
Take Figma as one example, a company that will be a massive fund returner for the VCs who invested early. It raised its Seed in 2013 at an estimated ~$15M valuation or $0.09/share; it raised its Series B in 2018 (5 years later) at an estimated $115M valuation or $0.33/share, a nice 3.7x price per share markup in 5 years, but not enough to drive a meaningful difference in TVPI, (a metric that investors and fund managers use to evaluate a fund's performance) and not nearly enough to mitigate the perceived negative impact of your losers and zeros.
It really wasn’t until its Series D in 2020 (7 years after the Seed!) when the Company hit a $2B valuation and $4.62/share (~51x price per share markup), did substantial TVPI impact take hold for those Seed investors and it’s since gone to ~5x price per share since then to $21.3/share or ~237x the Seed price per share. To underscore, ~98% of the gains on Figma took place 5+ years after that initial check for Seed investors.

"The first rule of compounding: Never interrupt it unnecessarily." - Charlie Munger
Point being, your venture portfolio will probably make you feel like crap for the first five years, but after that you should see your portfolio value begin to grow exponentially if your winners take hold. It took Figma 5 years just to 4-5x from the Seed, but then only took 2 additional years to be up 50x+ from the Seed and then only one more year for the price per share to be up 200x+ from the Seed. As mentioned, almost all of the gains for Seed investors were felt years 5-8 into the investment.
Let’s take another massively successful startup Databricks. If you invested in Databricks Series A in 2013, you would have only been marked up ~11x at the Series D in 2017, 4 years into the investment. A nice markup no question, but not much of a needle mover on TVPI and not enough to mentally overlook the pain from all the losers that have gone bust. However, by the end of 2021 or 8 years after your initial Series A investment, that 11x markup in 2017 is now a 286x markup on a price per share basis. Again, the gains compound and 5-8 years in, your outliers should start to turn exponential.
I’ve started to see this with my own portfolio. While we’ve had a number of companies fail fast, especially from the 2021 cohort, there are a number of outlier portfolio companies we made at Seed to Series A in 2020 and 2021 that are marked up 10-25x on a price per share basis and many more that are marked up 4-5x+. Over the next 1-4 years, we expect several of these will be marked up 100x+ from entry price (or 4-8x further) as compounding continues to take hold.
Of course, some companies do experience exponential growth much quicker, take Eleven Labs, which grew from inception to a $1B+ valuation within two years of the Seed financing, but that is not the norm and shouldn’t be the expectation.
So the entire cycle from initial investment to realizing significant returns can and likely will take many years. While it can be disillusioning when this happens, understanding the J Curve will almost certainly be helpful in helping you maintain a long-term perspective, which VC requires. Mainly be prepared for initial negative returns before potentially realizing substantial gains.
Generally the impact of the J Curve can be mitigated with a good strategy, mainly proper portfolio construction and diversification. If your portfolio strategy is off or you're not getting good access (note our Deal Sheet may solve the access problem), you’ll likely not have the J Curve take fold. The reality is if you’re investing in Pre Seed or Seed, you likely need a minimum of 25-30 shots on goal (the data suggest much more as missing the outlier is that costly), and if you’re only making 10 investments or investing without deep thought about your portfolio construction model / strategy, the J Curve may never take effect for you. It's just too few shots given the failure rates of startups.
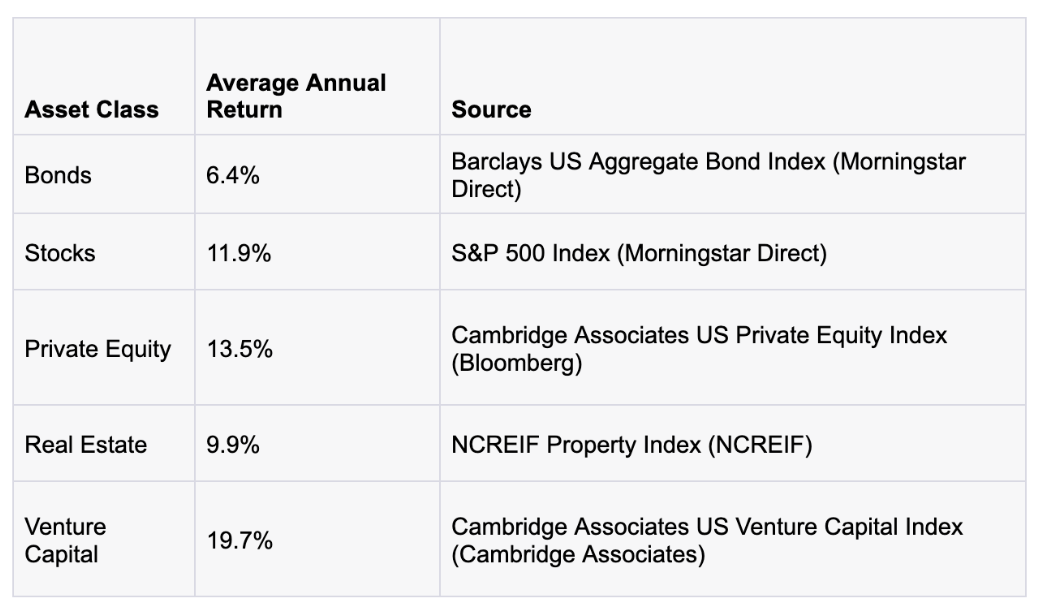
And if you’ve failed adequate venture strategy and access your first go around, if you can afford the risk, you may want to stay with the asset class. According to data from Cambridge Associates, the venture capital asset class had the best average annual returns from 1982 to 2021 against other major asset classes like stocks, PE and real estate. Of course, as VC is an outlier business, the tail end of high performing companies and funds are driving much of those returns.
Historical Average Annual Return from 1982-2021
In conclusion, understanding the J-curve is crucial for venture capital investors, especially those new to the asset class. While the initial years may be marked by apparent losses and disappointments, it's important to maintain a long-term perspective. The J-curve illustrates that patience is key in venture investing, with significant returns often taking 5-7 years or more to materialize.
Proper portfolio construction, access and diversification are essential strategies to navigate this curve effectively. Despite the challenges, venture capital has historically outperformed other major asset classes over the long term. For investors willing to weather the initial downturn and maintain a well-structured portfolio, the potential for substantial returns in the latter stages of the J-curve makes venture capital a compelling, albeit high-risk, investment option.
If you enjoyed this article, feel free to view our other prior adjacent articles:
Last Money in is Powered by Sydecar
Sydecar empowers syndicate leads to manage their investments more effectively. Organize, manage, and engage your investor network effortlessly with Sydecar’s management and communication tools. Their platform also automates banking, compliance, contracts, tax, and reporting, freeing up syndicate leads to focus on securing deals and strengthening investor relations. Elevate your syndicate operations with Sydecar.

If you enjoyed this post, please share on LinkedIn, X (fka Twitter), Meta and elsewhere. It goes a long way to support us!
We’ll be back in your inbox next Wednesday on our next topic. Thanks for tuning in!
Questions? Comments? Feedback? We welcome all, and would love to hear from you!
